AI
Moli's efficiency map blends two runs its own bench keeps apart
Source Audit of lexmount/moli at d56bbd7: the README’s Lexbench figures describe Moli 0.1.1 in a 1.1.7 tree, and its efficiency map joins two runs the benchmark keeps apart.
Editorial method: This Source Audit was researched and drafted with AI assistance under an evidence-gated editorial harness; every version, task count, threshold and README sentence quoted here was read from the pinned commit d56bbd7, the two linked Lexbench report files at their own pinned commits, or a bounded live API call before publication.
🤔 Curiosity: Which run is the README’s efficiency map actually showing?
lexmount/moli is a headless browser written in Rust for agent workloads. Its pitch is a cost model rather than a feature: the DOM and style state are the source of truth, and layout and paint run only when an operation needs them. At retrieval it carried 2,031 stars, the repository was created on 2026-08-10, and the pinned commit is the tip of main from 2026-09-16.
The README’s benchmark section is unusually rich for a project that is five weeks old. It has a 192-URL public-web crawl table, an agent-workload table, a WPT count, and two charts imported from a sibling benchmark repository, Lexbench-Headless-Browser. The section opens with a sentence that sets the reader’s expectation: “The following measurements show Moli’s current capability envelope.”
So the question this audit asks is narrow: for each number in that section, which harness, corpus, engine build and date produced it, and does the README present those numbers the way the producing harness says they may be presented? Four findings came out of the pinned tree, the two report files the README links, and the chart file itself.
- Every Lexbench number in the README is for Moli 0.1.1, measured on 2026-08-12 and 2026-08-13. The README that carries them ships in the 1.1.7 tree, seventeen tags later.
- The efficiency map’s vertical axis comes from a 1,928-task, k=3 run that collected no resource profile; its horizontal axis comes from a 557-task, k=5 run whose own card states that “functional capability scores are not combined with resource cost”. The README combines them on one chart.
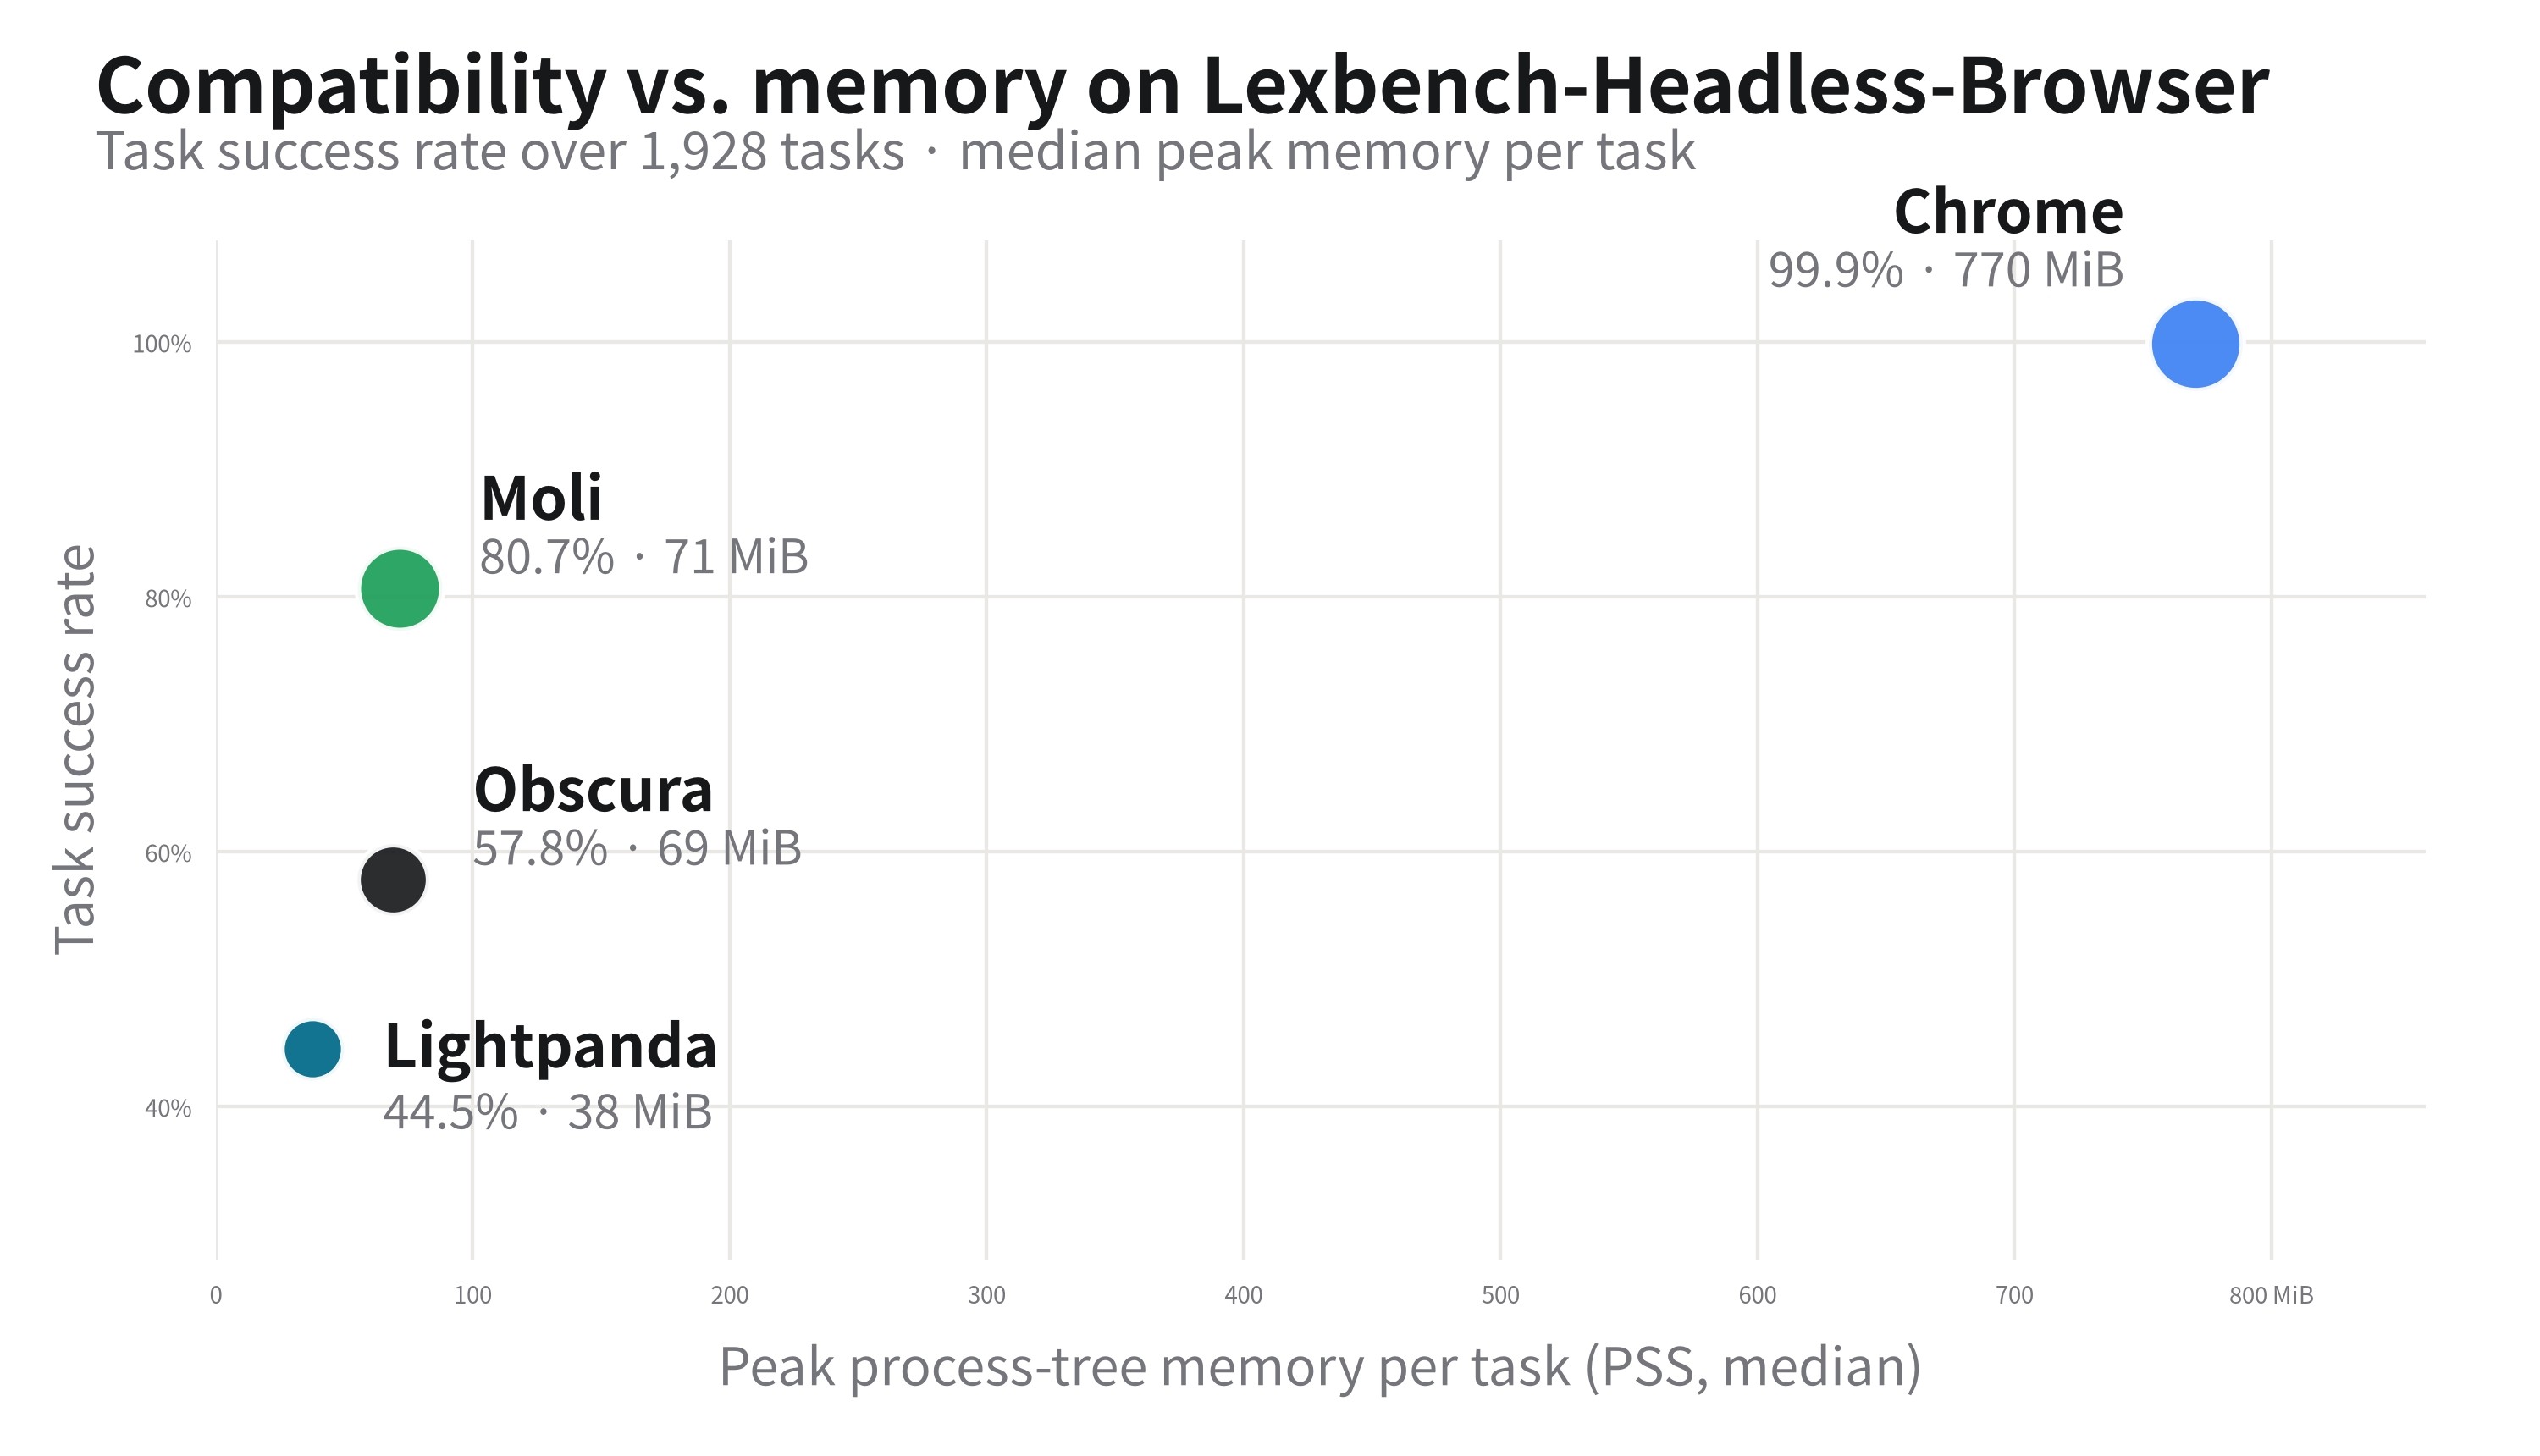
- The chart file shipped at d56bbd7 does not show the numbers the README’s alt text and prose give for it. The image reads Chrome 99.9% at 770 MiB, Moli 80.7% at 71 MiB, Obscura 57.8% at 69 MiB and Lightpanda 44.5% at 38 MiB; the alt text and prose say 697, 92, 34 and 39 MiB, with Lightpanda at 43.8% and Obscura at 39.5%. The image was replaced on 2026-09-13 in a commit that did not touch the README, and its numbers appear in none of the report files the README links.
- The crawl test’s “meaningful content” rule is, in code, a 256-byte visible-text floor plus marker lists. The README does not state the threshold, and the tree contains the target lists but not the run.
None of these is a hidden defect in the browser. They are provenance gaps in the way the numbers are shown, and they are the kind of gap an engineer needs closed before a benchmark chart becomes a procurement argument.
📚 Retrieve: The benchmark section, traced number by number
What the README says the numbers are
The README’s cost model is explicit and, as far as this audit read, consistently described: the default is LayoutPolicy::Mock, “deterministic geometry in a compatible format, with no real layout or paint”, and --layout switches to LayoutPolicy::OnDemand, where real layout, hit-testing, coordinate input, screenshots and screencast become available. Structure-first operations “skip layout and paint entirely”. That model is the reason the memory numbers are interesting at all, and it is the reason the comparison conditions matter: a browser that can skip layout is being compared with browsers that cannot.
The benchmark section then presents, in order:
| Block | What the README shows | Where the number comes from |
|---|---|---|
| Mixed public-web crawl | 192 URLs; Moli 103 useful pages (53.6%, 73 MiB median RSS), Chrome Headless 101 (52.6%, 773 MiB), Lightpanda 85, Obscura 57 | the in-repo Python runner moli-benchmark (top-sites suite) |
| Sample agent workload | CDP ready 34.85 ms vs 169.37 ms; peak PSS 102.46 MiB vs 348.82 MiB; 1 process / 24 threads vs 11 / 123 | the in-repo runner (agent-episode fixture) |
| WPT | “one full run passed 1.612 million tests” | the in-repo wpt_cross runner |
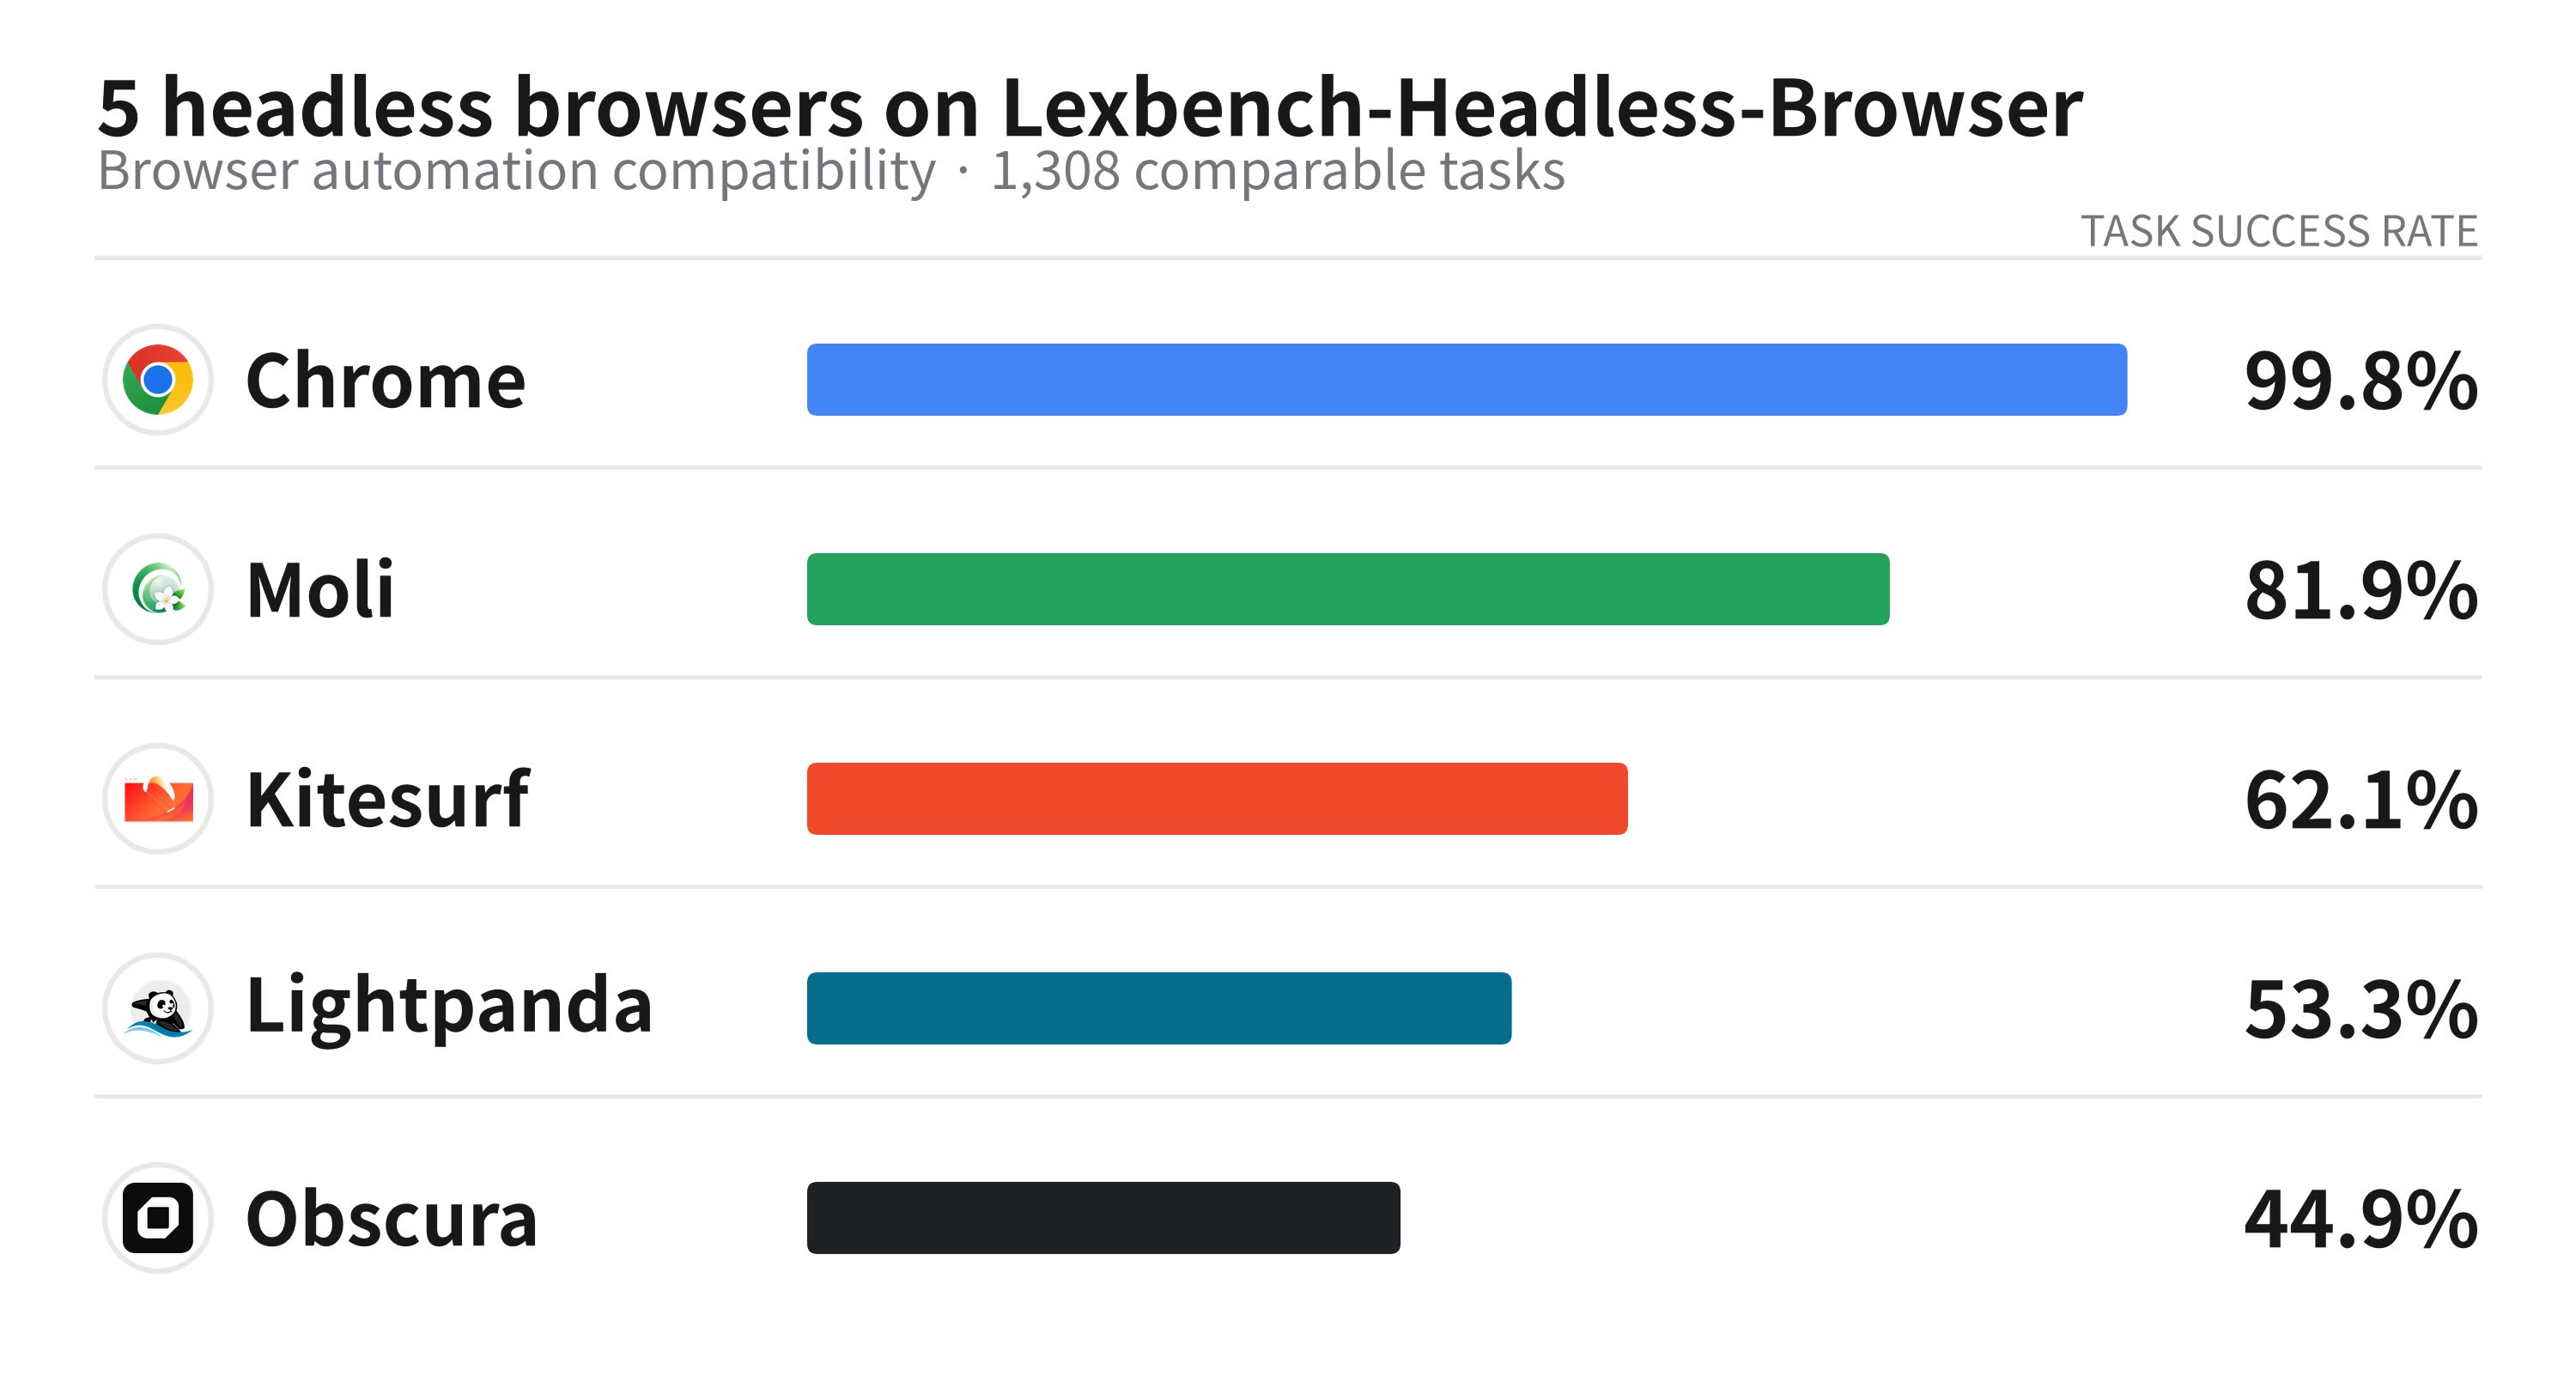
| Five-engine bar chart | 1,308 comparable tasks; Chrome 99.85%, Moli 81.88%, Kitesurf 62.08%, Lightpanda 53.29%, Obscura 44.88% | Lexbench five-engine report, 2026-08-13 |
| Efficiency map, alt text and prose | Chrome 99.9% / 697 MiB, Moli 80.7% / 92 MiB, Lightpanda 43.8% / 34 MiB, Obscura 39.5% / 39 MiB; “about 15% of Chrome’s CPU time and 13% of its peak memory” | Lexbench four-engine report (pass rates) and resource card (memory), both 2026-08-12 |
| Efficiency map, image file | Chrome 99.9% / 770 MiB, Moli 80.7% / 71 MiB, Obscura 57.8% / 69 MiB, Lightpanda 44.5% / 38 MiB; subtitle “over 1,928 tasks” | not found in any report file the README links; image replaced 2026-09-13 |
The third column is the audit. The README gives the source for the last two rows by linking the report files; the first three rows are attributed only by the runner’s existence in the tree. What follows takes the rows in reverse order of how much they claim.
The efficiency map is two runs on one chart
The README’s paragraph under the efficiency map is careful in one respect: it says the resource comparison “covers only the four local engines” and that “a separate 557-task run includes only work completed by all four”. What it does not say is that the vertical axis of the same chart comes from a different run again.
The pass rates the README’s alt text and prose attach to the chart, 99.9%, 80.7%, 43.8% and 39.5%, are the Lexbench four-engine report’s overview table: Chrome 151 1,926/1,928, Moli 0.1.1 1,556/1,928, Lightpanda 845/1,928, Obscura 762/1,928, from run four_engine_full_20260812 at k=3 with --jobs 16. That report’s validity section is explicit about what it did not collect:
No resource profile was collected in this run.
--resource-profilewas off; resource comparison requires separatebaselineandenginerounds under the A/B protocol.
The memory medians in the alt text and prose, 697 MiB, 92 MiB, 34 MiB and 39 MiB, are the resource card’s “All-pass intersection metrics” table from resource_engine_20260812. That run used a different corpus and different repetition: l1.raw_cdp (375) plus l2.web_platform (182), 557 tasks, --jobs 1 --k 5, because “running the full 1,928 tasks at jobs=1×k=5 is infeasible in wall-clock time”. Its medians are computed on the 1,045 task-attempts, out of 2,785 per engine, that all four engines passed.
The card states its own boundary twice. In the header: “resource profiling and functional scores are never blended”. In the card body: “functional capability scores are not combined with resource cost”. The README’s chart is a scatter plot whose x-axis is resource cost and whose y-axis is functional score, and the two values for each engine come from two different runs, corpora and k values. The alt text of the image calls it “task success rate plotted against median peak memory per task for the four local engines” without naming either run.
To be precise about what this does and does not mean: neither of the alt-text numbers is wrong, and both are reproducible from the linked reports. The chart is a presentation choice that the producing benchmark declines to make for itself. A reader who takes “80.7% at 92 MiB” as one measurement is reading a point that no single run produced.
The picture and its caption disagree
The image file says something else again. The lexbench-efficiency-map-light.jpg that ships at d56bbd7 is titled “Compatibility vs. memory on Lexbench-Headless-Browser”, subtitled “Task success rate over 1,928 tasks · median peak memory per task”, and plots Chrome at 99.9% and 770 MiB, Moli at 80.7% and 71 MiB, Obscura at 57.8% and 69 MiB, and Lightpanda at 44.5% and 38 MiB. Chrome’s and Moli’s pass rates match the alt text; all four memory values differ from it, and Obscura and Lightpanda trade places. The file history explains the split. Both chart images were added on 2026-08-19 in commit 3d3a90b, the same commit that wrote the alt text and the prose. Both were replaced on 2026-09-13 by commit 91f231d, “fix(doc): update lexbench-efficiency-map”, a two-file binary change that did not touch README.md. The alt text and prose still describe the August picture.
Where the September picture’s numbers come from, I could not establish. None of 770, 71, 69 or 38 MiB, 57.8% or 44.5% appears in the three report files at the commits the README links, in the reports on Lexbench’s main tip (3f1580a2, 2026-08-20, whose docs/reports/ holds only the two files dated 2026-08-12), on the kitesurf-eval branch (4cb0185f), or on chore/sync-main (cb726f5). They are not the README’s own crawl table either, which lists median RSS of 773, 73, 40 and 39 MiB for a different test and a different metric. The subtitle’s “over 1,928 tasks” points at the full corpus, but the only 1,928-task run in the linked reports collected no resource profile. So the chart as shipped carries four memory medians and two pass rates that no document the README links reproduces, under a caption that reproduces a different chart.
Why “work completed by all four” is not a neutral filter
The all-pass intersection is a defensible way to compare resource cost, because it holds the work constant. It also has a consequence the README’s summary sentence does not surface. In the resource run, Chrome passed 2,763 of 2,785 attempts and Moli 2,662, but Lightpanda passed 1,465 and Obscura 1,295. The intersection is 1,045 attempts, 37.5% of each engine’s attempts, and it cannot contain any attempt the weakest engine failed. [Inferred] The medians therefore describe the slice of the 557-task corpus that Lightpanda and Obscura complete, which is not the same population as the tasks Moli or Chrome complete, and the card does not characterise how that slice differs in difficulty. The README’s “15% of Chrome’s CPU time and 13% of its peak memory” is true on that slice; whether it holds on the tasks the two weaker engines fail is not something either document measures.
Every Lexbench number is Moli 0.1.1
The four-engine report’s artifact-provenance table pins the build it measured: “moli 0.1.1”, SHA-256 prefix 74e08f8d3eb6, against Chrome 151.0.7922.47. The five-engine report is dated 2026-08-13 and does not rerun the local columns; it says so. The README repeats the version in prose, “Moli 0.1.1 passed 1,071 tasks”, so the attribution is not hidden.
What the README does not carry is the distance between that build and the tree the README lives in. At the pinned commit moli/Cargo.toml declares version = "1.1.7". The GitHub tag list runs v0.1.0, v0.1.1, v0.1.2, v0.1.3, v1.0.0 through v1.0.6, and v1.1.0 through v1.1.7: nineteen tags. The v0.1.1 release is dated 2026-08-11 and the v1.1.7 release 2026-09-16. Seventeen tags later, including a major-version boundary, the tree next to the charts is v1.1.7, and the pinned commit is one more change on top of it.
Read against the section’s opening sentence, “the following measurements show Moli’s current capability envelope”, the word current is doing work the numbers cannot support. They show the envelope of a build from the project’s second tag. That is a fair thing for a young project to publish; the fair way to label it is by version and date, not by current.
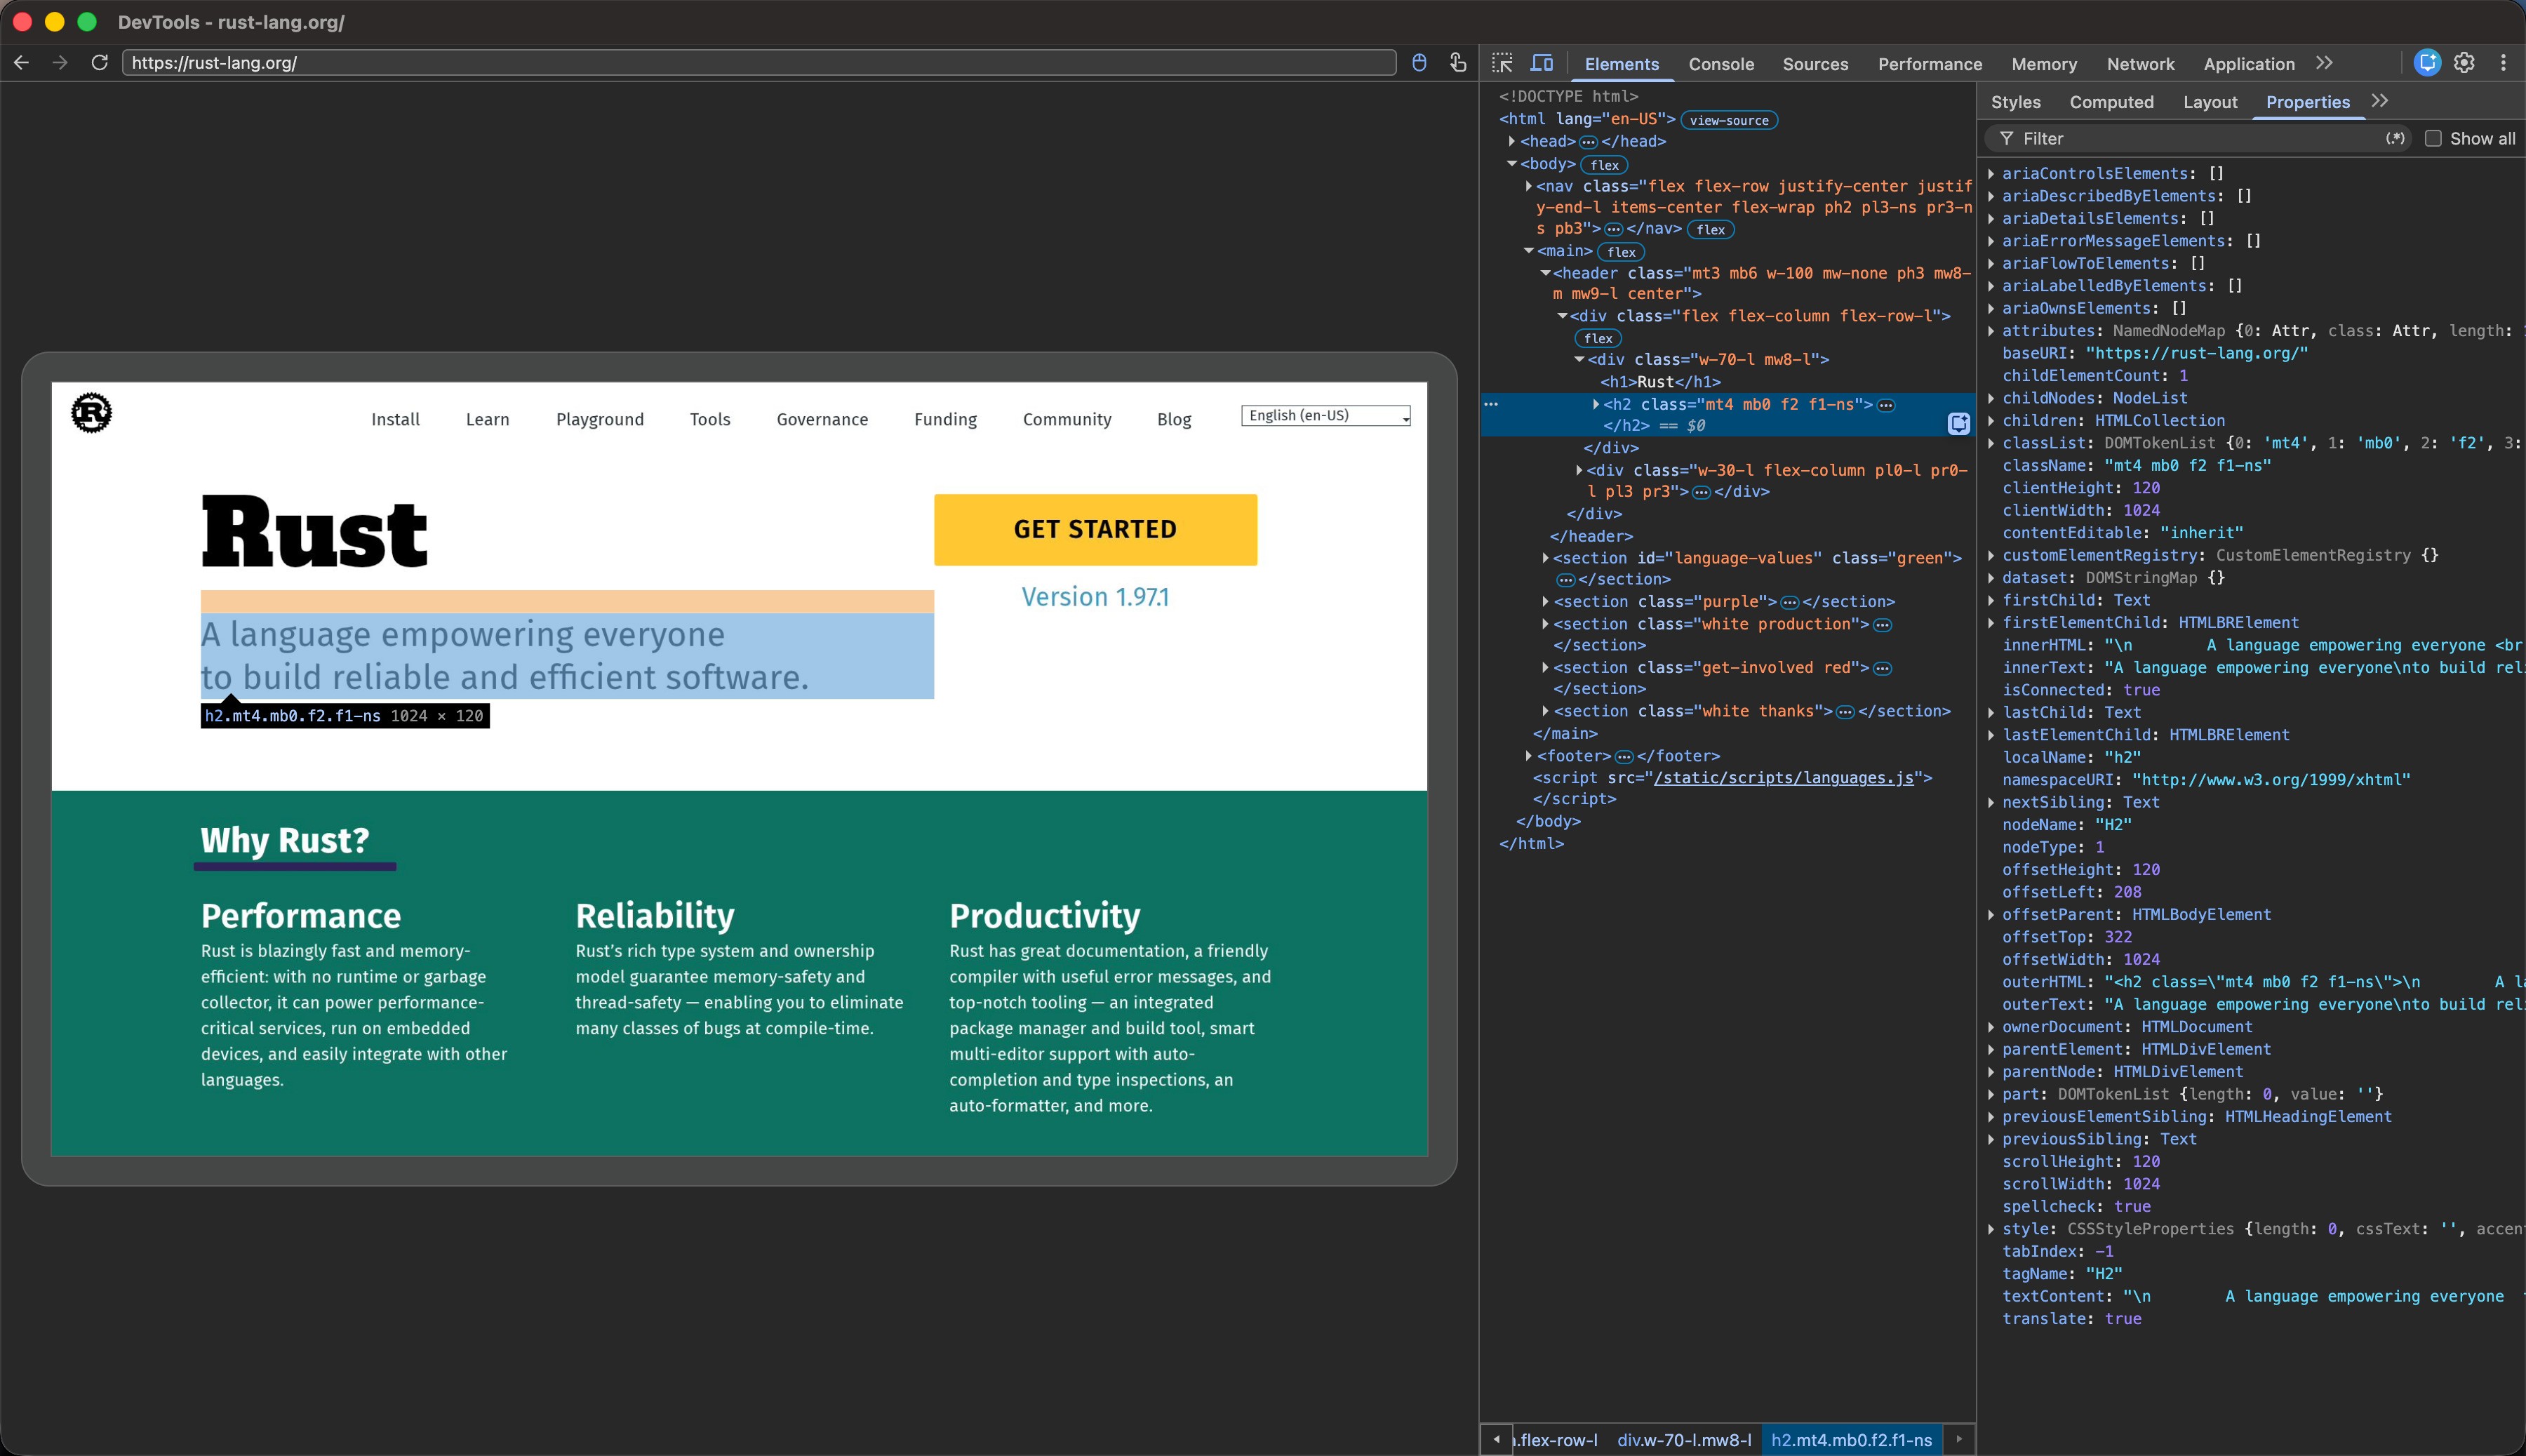
--layout mode. This is the mode where Moli pays for layout and paint; the structure-first default that the memory comparison favours produces no such frame — Image from lexmount/moli (MIT OR Apache-2.0 at d56bbd7), commit d56bbd7. Source: https://github.com/lexmount/moli/blob/d56bbd7c28706769df3ab35b144d730b5a413bf5/README.md. Publisher: Moli contributors (lexmount/moli). Licence: MIT.“Meaningful content” is a 256-byte floor and a marker list
The crawl table is the row where Moli edges past Chrome Headless, 103 useful pages to 101, so its success rule matters more than the others. The README describes the rule in prose: a page counts only “if it produces meaningful content after JavaScript runs — an HTTP 200, challenge page, login wall, empty response, or shell-only application does not count.”
In the in-repo runner, that sentence is PublicWebClassifier._classify_top_sites_document in moli-benchmark/moli_benchmark/public_web.py. The order of checks is: timeout, HTTP status of the main document, network-failure markers, non-zero exit, empty body, binary content, inferred HTTP errors from the title, blocked or forbidden titles, not-found markers, blocked-body markers, captcha markers, JS-challenge markers (strings such as cf-challenge and window.solvechallenge(), and a login-wall heuristic built on marker lists. Only after all of those does the classifier decide between the two categories the README’s sentence hinges on:
1
2
3
if len(body) < min_body_bytes or text_length < min_body_bytes:
    return "app-shell-only"
return "success-content"
min_body_bytes is not 1 in the suite that produced the table. top_sites.py sets DEFAULT_TOP_SITES_MIN_BODY_BYTES = 256, and cli.py exposes it as --top-sites-min-body-bytes on the run command and --min-body-bytes on the top-sites and render-compare commands. So “shell-only application” means, operationally, fewer than 256 bytes of extracted visible text after the marker checks pass. That is a reasonable floor. It is also a parameter, and the README reports the outcome without it.
Two more things the tree does and does not hold. It holds the target lists: three rank,target CSVs of bare hostnames, a 100-entry global list, a 100-entry Chinese-community list and a 6-entry legacy-encoding list, 206 targets, with chinese-community as the default source and profiles of 20, 100 and 300 targets. It does not hold the 192-URL run: the recursive tree listing of 7,415 paths at the pinned commit has no results, reports or runs directory under moli-benchmark/. The runner’s own README promises that it “records the environment and browser versions, keeps raw measurements, and produces a self-contained HTML report”, and that record exists somewhere; it is not in the tree next to the table.
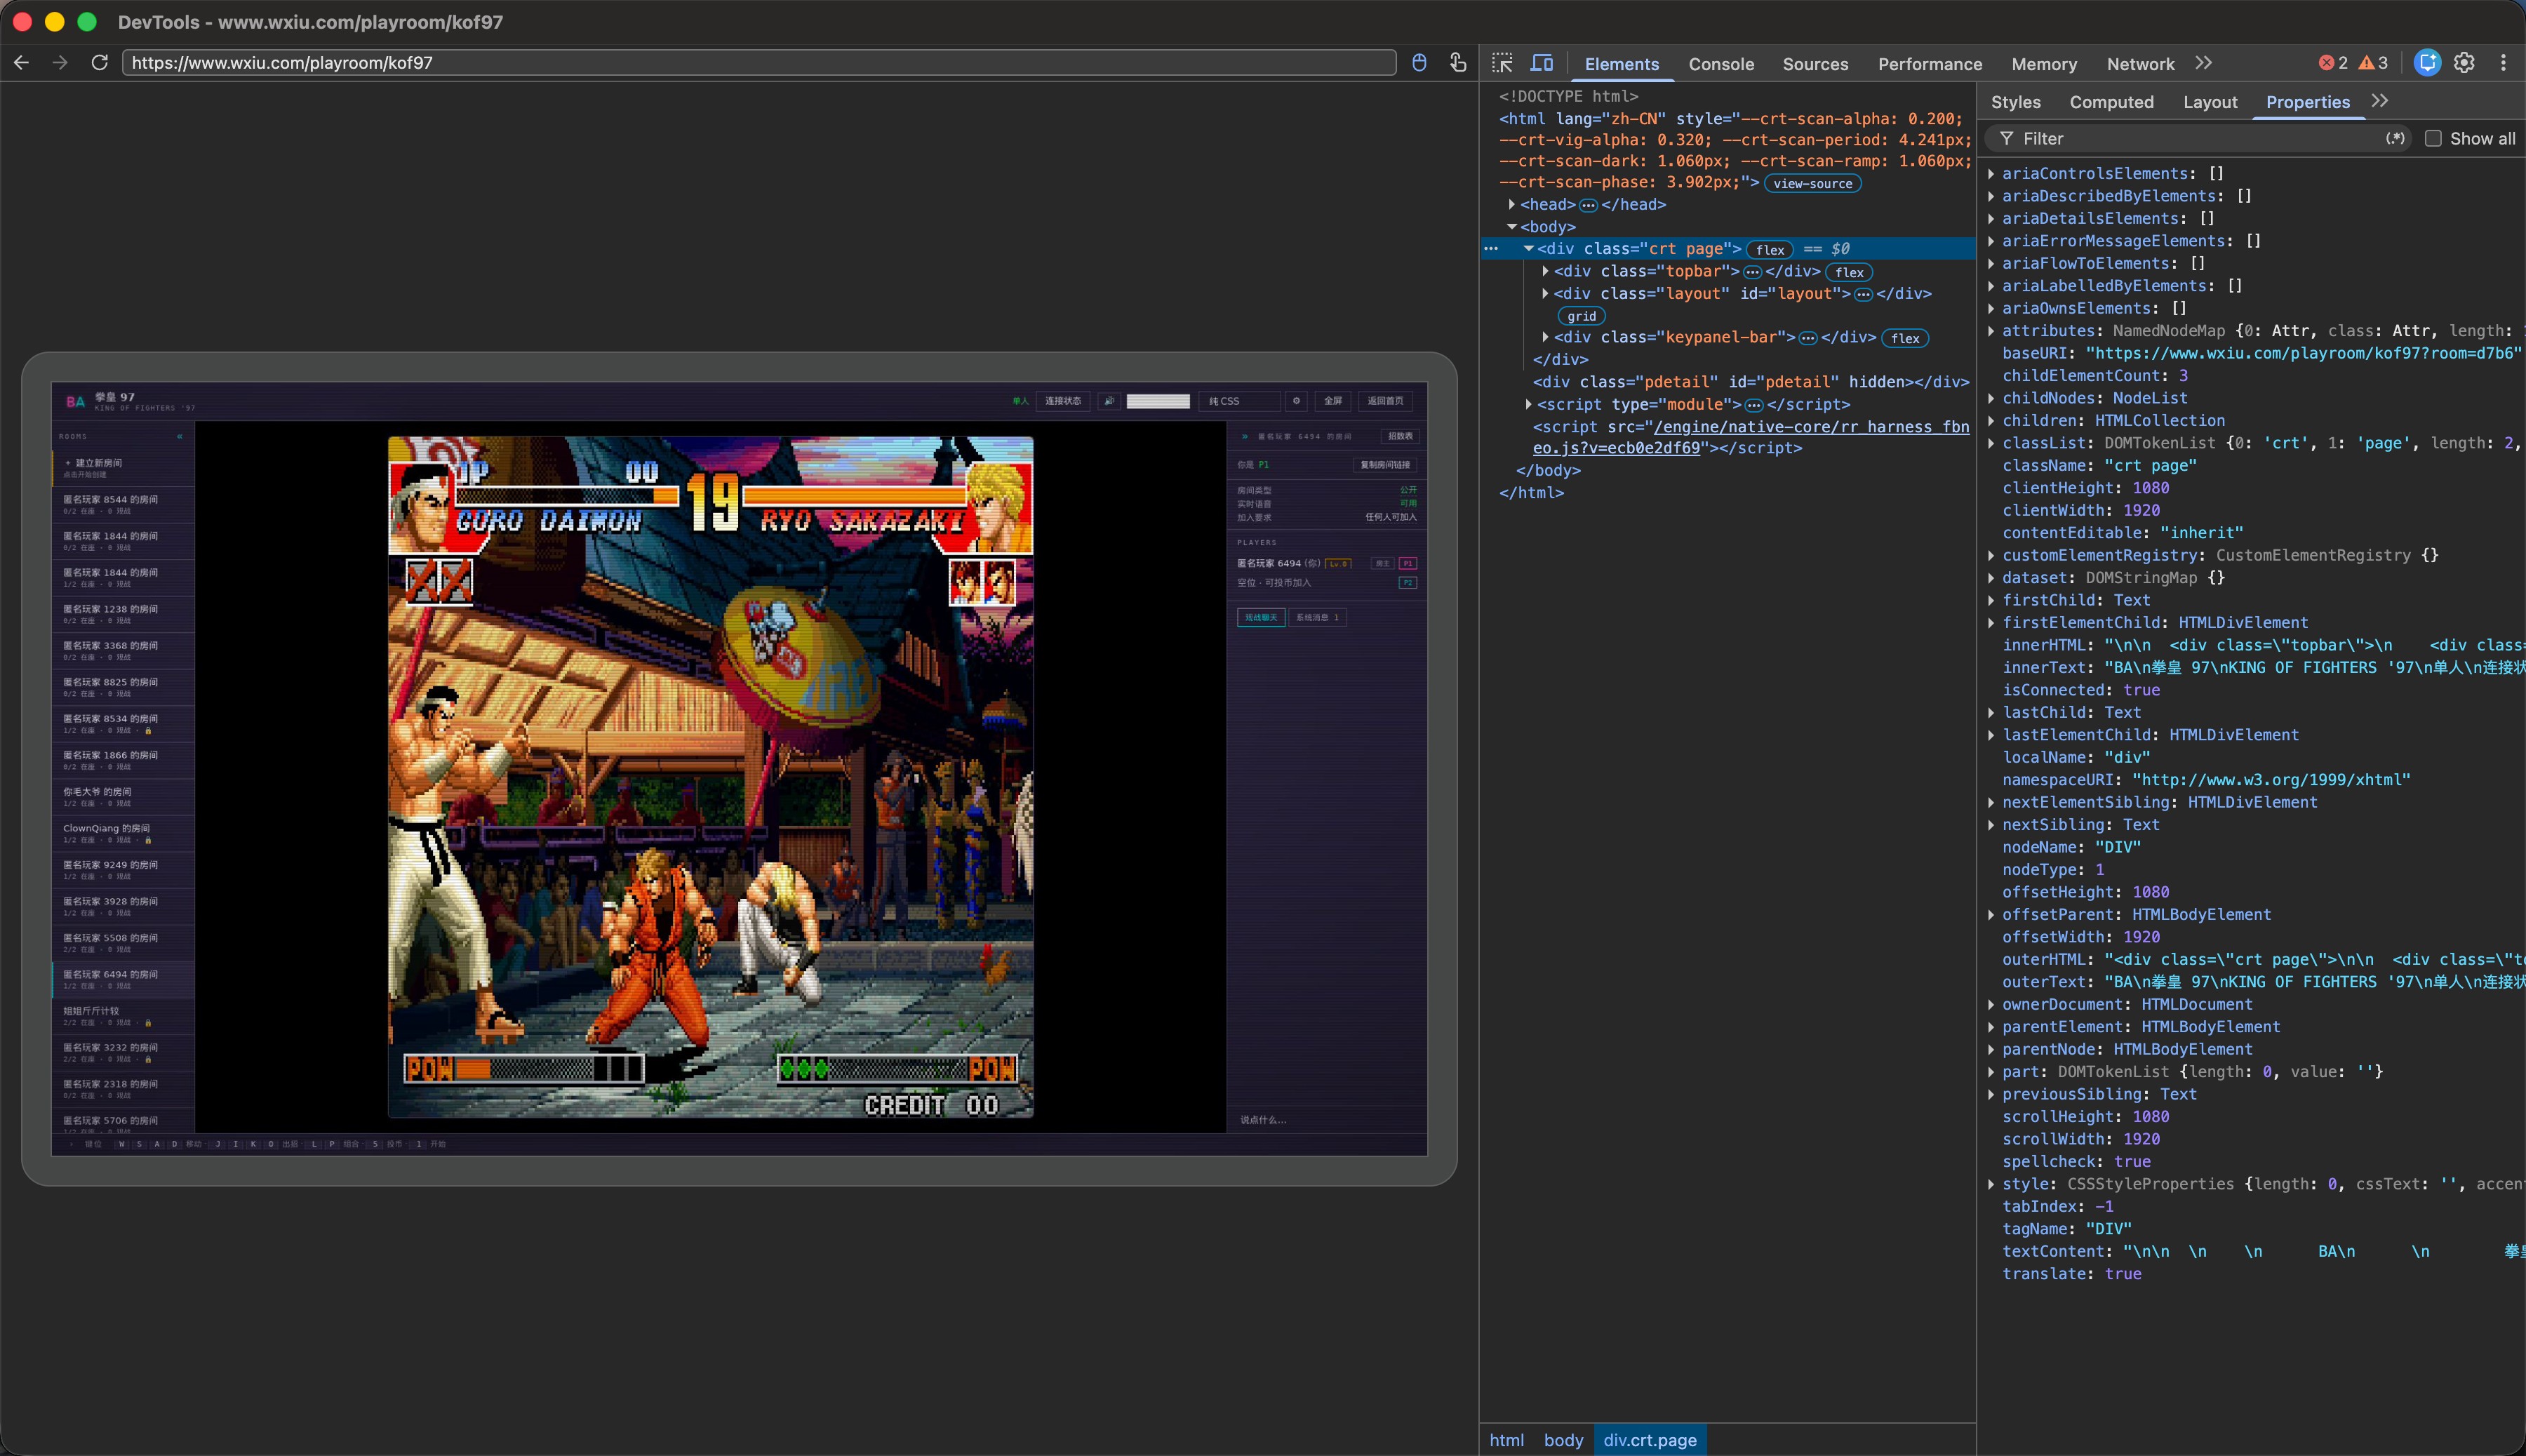
--layout mode. The crawl table's 73 MiB median RSS is a structure-first number; pages rendered like this one cost more, and the README's cost-control table says so — Image from lexmount/moli (MIT OR Apache-2.0 at d56bbd7), commit d56bbd7. Source: https://github.com/lexmount/moli/blob/d56bbd7c28706769df3ab35b144d730b5a413bf5/README.md. Publisher: Moli contributors (lexmount/moli). Licence: MIT.Three harnesses, one section
Counting the sources restores a structure the README flattens. The crawl, agent-workload and WPT rows come from the Python runner in moli-benchmark/. The two charts come from Lexbench, a separate repository with its own corpus, its own scoring modes and its own report files. And there is a third harness the README does not mention at all: the Node runner under moli-benchmark/browser-spider-local/, whose results CI publishes on every pull request through the “Spider Bench Report” workflow, which waits for the immutable spider-bench-results artifact and “renders only bounded numeric fields into an Actions summary and an upserted PR comment”.
That third harness is, from a reader’s point of view, the most trustworthy of the three, because it runs on the code under review rather than on a build from August. It is also the one whose numbers are not in the README.
💡 Innovation: Read a vendor benchmark section by restoring its provenance columns
The practical output of this audit is a checklist, because the pattern is not specific to Moli. Any project that imports charts from a benchmark repository into a README will, over time, drift from the build that was measured and will be tempted to compose one figure from several runs. Before a chart from a README enters a comparison document, restore four columns the README usually drops.
| Column to restore | Moli README today | What a reader needs |
|---|---|---|
| Engine build | “Moli 0.1.1” in prose; tree at 1.1.7 | the tag or SHA measured, and its distance from the tree |
| Run identity | two charts, three runs, none named; one chart file replaced after its caption was written | run id, date, corpus size, k, jobs |
| Scoring rule | “meaningful content” | the threshold (256 bytes) and the marker lists |
| Population | “four local engines” / “work completed by all four” | which attempts survived each filter, and what that excludes |
For Moli specifically, the fixes are small and all inside the README. Print the run ids and corpus sizes under each chart. Re-derive the alt text and the prose from the same run whenever a chart file is replaced, or the caption starts describing a picture that is no longer there. Replace current with the version and date. State the 256-byte floor next to the crawl table, or link the classifier. Either regenerate the Lexbench charts at each tagged release, or move them under a heading that says which release they describe. And publish the Spider Bench numbers, since those are the ones that track the code.
For readers who followed the CodeBurn hard-cap audit, this is the mirror case: there, a README sentence (“stops the session”) read stronger than the shipped mechanism; here, the mechanism is well documented in the benchmark’s own files and the README’s summary reads stronger than the files allow. The OpenOcta licence-drift audit is the same failure mode in metadata rather than measurement: a README that stopped tracking the artefact it describes.
Limitations
- This audit did not run Moli, Chrome, Lightpanda, Obscura or either benchmark harness. Every number is read from the pinned tree and the two report files; nothing here says whether 1.1.7 would score higher or lower than 0.1.1.
- The Lexbench report files were read on branches (
main,kitesurf-eval) pinned to their commits at retrieval; the README links them by branch, so a later edit to those files would not be reflected here. - The 192-URL crawl run and its per-site outcomes were not available in the tree; the 206-target fixture count is not a claim that 192 is wrong, only that the run cannot be re-derived from the pinned commit.
- Tag dates come from GitHub’s tag and release pages, not the REST API, and are release timestamps rather than commit timestamps.
- The intersection argument in the resource section is labelled as inference; the card publishes the counts but not the difficulty distribution of the intersection.
- The numbers attributed to the shipped chart image were read from the rendered labels of the raster at its full 3000×1720 resolution; the image carries no data table, so “770 MiB” is what the picture prints, not a value from a report.
🎯 Key Takeaways
- The README’s efficiency map, as its alt text and prose describe it, combines pass rates from a 1,928-task, k=3 run with memory medians from a 557-task, k=5 run; the resource card that produced the memory numbers says functional scores and resource cost are never blended.
- The chart image that actually ships at d56bbd7 shows different numbers from that caption (770, 71, 69 and 38 MiB; Obscura 57.8%, Lightpanda 44.5%), was replaced on 2026-09-13 without a README change, and traces to no report file the README links.
- All Lexbench figures in the README describe Moli 0.1.1 (2026-08-12/13); the README ships in the 1.1.7 tree, seventeen tags and one major version later, under the heading “current capability envelope”.
- The crawl test’s “meaningful content” is a 256-byte visible-text floor after marker checks, set in
top_sites.py; the README does not state it, and the tree holds the target lists but not the run. - A third, per-pull-request harness (Spider Bench) exists and is the only one that measures the code under review; its numbers are not in the README.
🤔 New Questions
- Would rerunning the four-engine Lexbench corpus at v1.1.7 move Moli’s 80.71%, and in which subsets? The
l1.playwright(96/142) andl1.puppeteer(96/143) rows are where the 0.1.1 build lost most ground. - How does the all-pass intersection’s difficulty compare with the full 557-task corpus? Publishing per-task CPU and PSS for all attempts, not only the intersection, would answer it without a new run.
- Does the Spider Bench artifact carry enough fields to reconstruct the README’s crawl table on each PR, and if so, why not surface it?
- Which run produced the chart image committed on 2026-09-13, and was the alt text meant to follow it? Publishing that run’s report, or regenerating the image from the 2026-08-12 card, would close the gap either way.
References
Primary sources (pinned)
- lexmount/moli at d56bbd7 — README benchmark section, cost-control table,
moli/Cargo.toml(version = "1.1.7"),license-metadata.json - moli-benchmark/moli_benchmark/public_web.py —
_classify_top_sites_documentand the marker lists - moli-benchmark/moli_benchmark/top_sites.py —
DEFAULT_TOP_SITES_MIN_BODY_BYTES = 256, profiles and default source - moli-benchmark/fixtures/top-sites — the three committed target lists
- .github/workflows/spider-bench-comment.yml — the per-PR benchmark comment workflow
- moli-benchmark/README.md — the in-repo runner’s own description
Benchmark reports (pinned)
- Lexbench four-engine report, 2026-08-12 — 1,928 tasks, k=3, pass rates, artifact provenance, “No resource profile was collected in this run”
- Lexbench resource card, 2026-08-12 — 557 tasks, k=5, all-pass intersection, “never blended”
- Lexbench five-engine report, 2026-08-13 — Caliber A and B definitions, 81.88%
- lexmount/moli tags — v0.1.1 (2026-08-11) to v1.1.7 (2026-09-16)
Related audits on this site
Working on something like this?
I take a small number of paid, scoped reviews: AI agent/RAG architecture diagnosis, Unity CI & build-automation audits, and multimodal QA design review. Each one ends in a written findings document.
Work with me