AI
Godot's Physics Time Keeps the Slowest Step, Not the Sum
A static Godot source audit traces Physics Time to a maximum reducer and Physics Frame % to a fixed interval, separating engine findings from illustrative arithmetic.

In the Godot source I inspected, Physics Time is the longest completed sampled physics window in one main-loop iteration, not their sum. And Physics Frame % divides by the fixed physics update interval, not by measured Physics Time. A calm-looking row can therefore answer a narrower question than “how much physics work did this frame contain?”
Scope: Source Audit, October 6, 2026. Engine source is pinned to ed1daf0b (resolved from 4.7.2-stable); documentation is pinned separately to 9adca4c1. I read the timing producer, debugger transfer and editor consumer. I did not build Godot, run a game, capture profiler traffic or measure a slowdown. The executable check below tests synthetic arithmetic only. The official screenshots are documentation examples, not captures from this audit. This is an evergreen measurement-contract finding, not a claim about a newly released regression.
What does a physics row actually measure?
Suppose a delayed main-loop iteration performs several physics updates. You want to decide whether those updates consumed too much time together, whether one update was unusually expensive, or whether rendering is the real problem. Those are different questions. A label that says “Physics Time” does not tell you which reducer sits underneath it.
The profiler documentation describes Physics Time as time spent updating physics tasks, including _physics_process. That is a useful starting point, but it does not spell out the multi-step aggregation. I followed the value rather than guessing from the name.
The same documentation says profiling is performance-intensive and off by default: run the project, open Debugger → Profiler and press Start. It also says the built-in profiler does not currently support C# scripts, directing those users to Rider or dotTrace with Godot support. Those are documented boundaries, not overhead or support tests I performed.
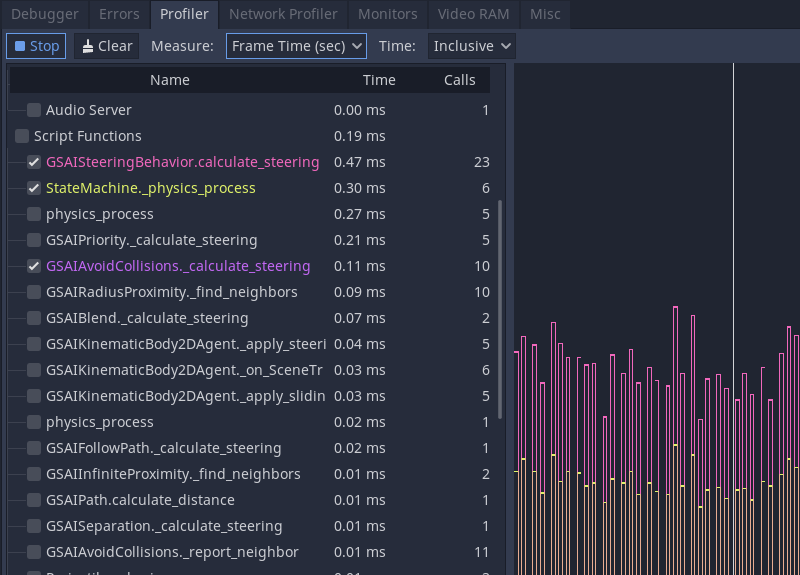
Technical Analysis: the reducer survives all the way to the label
One iteration, several samples, one maximum
In main/main.cpp, Main::iteration() resets physics_process_ticks to zero before looping over advance.physics_steps. Within each step it records physics_begin after input flushing. The sampled window covers the subsequent preparation, physics processing, enabled server work and end-of-iteration callback before this update:
1
2
3
4
// Godot main/main.cpp @ ed1daf0b, line 5049 (MIT-licensed source).
physics_process_ticks = MAX(physics_process_ticks,
    OS::get_singleton()->get_ticks_usec() - physics_begin);
// The source comment says: "keep the largest one for reference".
That is a maximum reducer, not an accumulator. After completed sampled windows of 2, 4 and 3 milliseconds, it retains 4, not 9. The main-loop function then passes that value into EngineDebugger::iteration, which converts microseconds to seconds and dispatches ticks only to active profilers with a tick callback. On a sent profiling frame, ServersProfiler preserves the maximum in the frame’s physics field. After receipt, ScriptEditorDebugger copies it into the metric; when frame.servers.size() is nonzero, the editor also assigns it to the item named “Physics Time”. The editor does not reconstruct the sum at that hand-off. This is a data-flow trace, not a promise that every iteration emits or displays a row.
There are two important limits. If no physics step runs, the initialized value remains zero. If physics_process() requests exit, an early break occurs before the MAX update, so that exiting step is not part of the retained sample. “Slowest step” in this article means the slowest completed sampled timing window on this path, not every bit of physics-related work and not a GPU duration.
| Static trace at the pinned source | Meaning |
|---|---|
main.cpp:4945,4970,4980,5049 | Reset, loop, sample start, MAX reduction |
main.cpp:5115 → engine_debugger.cpp:107–118 | Forward maximum; convert ticks to seconds |
servers_debugger.cpp:287–313,343–349 | Copy into profiler frame and send |
script_editor_debugger.cpp:789–811 | Assign the received value to Physics Time |
The percentage denominator is a budget, not measured work
The main loop calculates physics_step = 1.0 / physics_ticks_per_second and passes that separately to the debugger. The editor names the received value “Physics Frame Time”. It is the configured update interval, distinct from the sampled workload.
In EditorProfiler::_get_time_as_text, the Physics Frame % branch divides p_time by m.physics_frame_time, then multiplies by 100. It uses a small fallback denominator if that field is zero. The constructor’s exact menu label is “Physics Frame %” (editor_profiler.cpp:712). The pinned profiler documentation instead uses the older shorthand and says “Physics % is relative to Physics Time.” For the inspected consumer, the precise denominator is Physics Frame Time. I would use the code’s distinction when interpreting this build, rather than silently treating those two names as interchangeable.
There is a second documentation mismatch worth noticing before reading a graph. The two default plotted signatures in editor_profiler.cpp are physics_frame_time and category_frame_time, both in construction and reset. The docs describe the defaults as Frame Time and Physics Time. At this pin, one default curve is the fixed physics interval, not the measured Physics Time item. This is a static label-and-signature comparison, not an editor session I recorded.
A small arithmetic check, not an engine benchmark
Here is the positive-interval example I executed in Node. The durations are invented inputs, explicitly chosen to make max and sum differ:
1
2
3
4
5
6
7
8
9
// Synthetic arithmetic only. Not a Godot runtime test.
const windowsUs = [2000, 4000, 3000];
const maximumMs = windowsUs.reduce((m, t) => Math.max(m, t), 0) / 1000;
const sumMs = windowsUs.reduce((s, t) => s + t, 0) / 1000;
const intervalMs = 1000 / 60;
const physicsPercent = maximumMs / intervalMs * 100;
if (maximumMs !== 4 || sumMs !== 9 ||
    Math.abs(physicsPercent - 24) > 1e-9) throw new Error('arithmetic mismatch');
console.log({ maximumMs, sumMs, intervalMs, physicsPercent });
The check returned maximum 4 ms, sum 9 ms, interval 16.666… ms and Physics Frame % 24. It proves the arithmetic distinction. It does not prove that any real Godot frame took these times or even performed three updates. Do not copy those numbers into a performance claim.
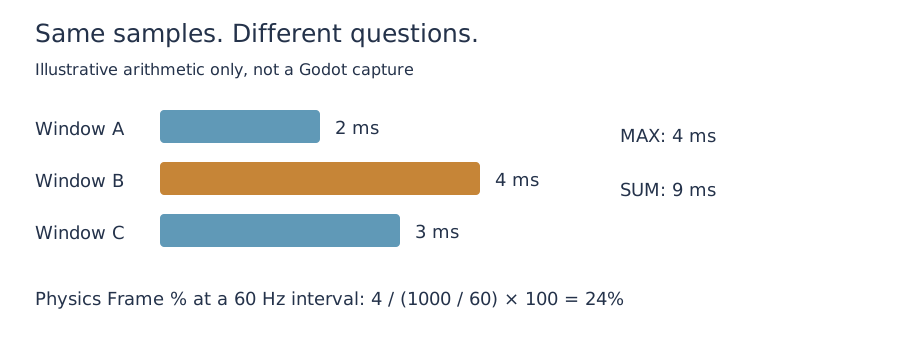
Original explanatory diagram. Synthetic inputs, not measured engine data; generated cover art is also illustrative and uncounted as source evidence.
Scope is a separate question from aggregation
The docs’ Inclusive and Self examples show another way a timing row can mislead. Inclusive includes nested function calls. In their example, move_subject, get_neighbors and find_nearest_neighbor all look expensive.
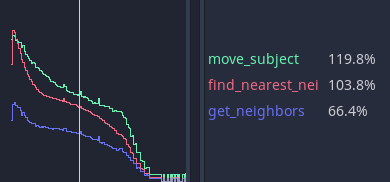
Switching to Self removes time spent in calls made by each function. In the documentation example, the callers shrink while find_nearest_neighbor remains prominent. That changes where to inspect code; it does not turn the main-loop MAX into a sum.
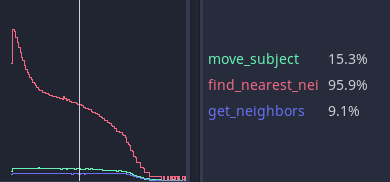
Give every diagnostic number a contract
My proposed diagnostic sequence is deliberately small:
- Name the question first. Is it worst completed physics sample, total work across updates, expensive function body, or rendering cost? Do not assign one field all four jobs.
- Keep aggregation and scope separate. Record the field name, sampled window, reducer, units, denominator and number of updates. When instrumenting a project callback, label its total as callback time: it does not cover all the engine work inside the broader timing window.
- Select curves explicitly. For a measured physics cost, inspect the Physics Time item rather than assuming the default interval curve is workload. Then use Inclusive and Self to distinguish expensive callees from their callers.
- Investigate rendering separately when appropriate. The pinned debugger docs say the Visual Profiler breaks down CPU and GPU rendering work, excluding scripting and physics CPU time. They describe support across rendering methods, with Compatibility on macOS specifically unsupported. Keep viewport size equal across comparisons, as the docs request.
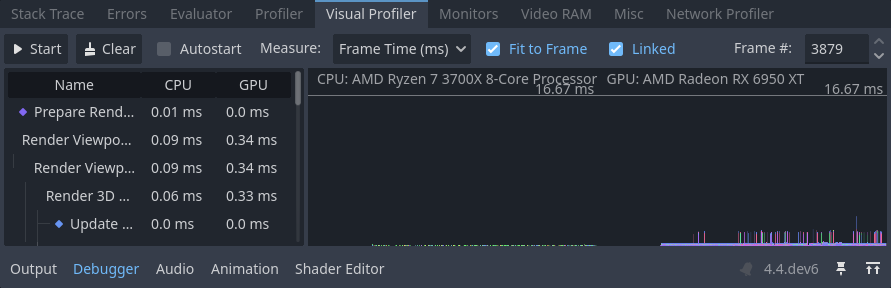
This is a proposed workflow, not one I have validated on a game. In particular, you cannot obtain total physics work just by multiplying the maximum by a step count, unless every measured window happens to take the same duration. Nor would I subtract the maximum from a frame timing field and call the remainder “non-physics cost”. The reducers and sampled boundaries must match before that subtraction has the meaning you want.
For a game-development agent, this distinction belongs in the evidence it hands back to a human. “Physics is only 24%” is not a useful conclusion without a denominator, reducer and actual observation. A screenshot is valuable context, but a machine-readable record of the measurement contract makes the conclusion auditable.
The next useful comparison is GameDevBench’s confinement-aware leaderboard audit: a result also inherits the environment and boundary that produced it. The Headroom rerun’s measurement-scope audit applies the same caution to a different kind of performance claim. Neither is evidence for Godot’s timings; they are related examples of reading the contract before the number.
Key Takeaways
- Static source finding: Physics Time receives a per-main-loop maximum of completed sampled physics windows, not their sum.
- Static consumer finding: Physics Frame % uses the fixed Physics Frame Time interval; the inspected default plot includes that interval curve.
- Executed here: only synthetic arithmetic, yielding 4 ms versus 9 ms and a 24% interval ratio. No Godot runtime or benchmark was executed.
- Documented scope: Inclusive/Self separates nested costs; Visual Profiler investigates rendering, not physics CPU work.
- Proposed next step: capture an actual frame with step count and explicitly scoped timing totals before concluding that physics is or is not the bottleneck.
New Questions
- How often does a representative scene execute multiple physics updates in one main-loop iteration?
- Does a runtime capture at this exact engine pin show the expected max and fixed-interval values end to end?
- Would a separately named sum-of-windows metric help QA tools without confusing it with callback-only timing?
Those questions remain unmeasured here. A source trace defines the hypothesis; an engine capture should test it.
References
Code and implementation, Godot source at ed1daf0b:
- Main-loop producer
- EngineDebugger timing conversion
- ServersProfiler transfer
- Editor timing labels
- Exact percentage menu label
- Default plotted signatures
Documentation and image rights, docs at 9adca4c1:
- Profiler guide
- Debugger panel and Visual Profiler
- Explicit repository image/content license scope
- CC BY 3.0 legal code. All four official documentation images are reproduced unmodified, attributed individually above; no endorsement is implied.
- Godot source MIT license
Editorial method: claims in this article point to primary documentation, pinned source code, runnable checks, or dated measurements, with AI-assisted research under the site's evidence-gated policy. How this site verifies claims and discloses AI assistance · Report a correction.
Working on something like this?
I take a small number of paid, scoped reviews: AI agent/RAG architecture diagnosis, Unity CI & build-automation audits, and multimodal QA design review. Each one ends in a written findings document.
Work with me