AI
Superlog's findings gate stops short of resolution proof
A source audit of Superlog’s findings gate, outcome validation and declared server dispatch separates payload acceptance from incident-resolution proof.
Does an accepted outcome prove that an incident is resolved?
Not from the inspected Superlog source alone. Four named tools require findings in the visible validation contract, and the resolution validator checks important payload details. But those checks are not evidence that the payload covers every linked Issue or that an atomic server-side resolution transaction completed. The inspected declarations ask for those stronger effects; the implementation evidence captured here stops before proving them.
That distinction matters when replacing the model backend: the integration question is not merely whether a model can produce the right tool arguments. Integration inference: it is whether the replacement preserves the worker’s boundaries and whether separate evidence supports the server effects its output requests. A syntactically acceptable result should not become a resolution receipt by implication.
The pinned README describes Superlog as an agentic telemetry system with a community runner and pluggable runner interfaces. That is repository positioning, not a deployment observed for this article. The useful audit target is the contract between external evidence, model context, outcome validation and declared dispatch.
What the findings gate actually checks
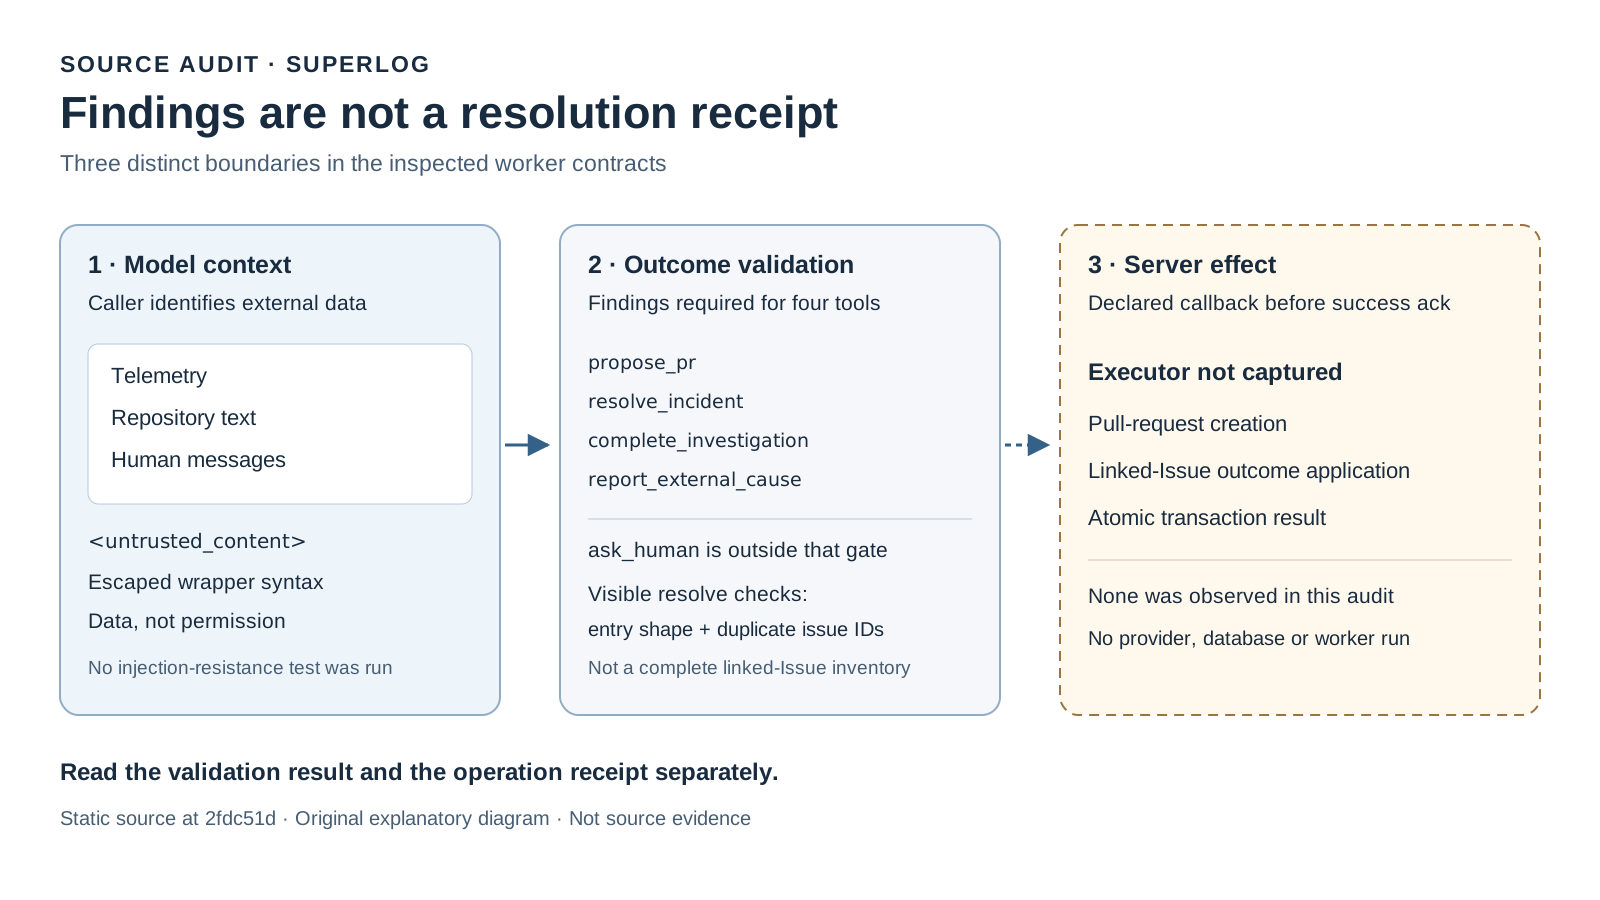
In the inspected outcome-tool implementation, FINDINGS_REQUIRED contains propose_pr, resolve_incident, complete_investigation and report_external_cause. Terminal ask_human is outside that set. Calling the rule a universal terminal-tool gate would therefore overstate it: the distinction is tool-specific, not simply terminal versus nonterminal.
For resolve_incident, the visible validator checks required strings, the shape of each entry and duplicate issue IDs. The declaration also asks for one outcome per linked Issue and atomic application. Those are different obligations. Checking the entries supplied in an argument is not, by itself, a comparison against the complete linked-Issue inventory.
The backend type comments declare a server dispatch callback before success acknowledgement. That strengthens the stated integration contract, but the captured evidence does not include the server executor, the linked-Issue inventory or the transaction implementation. It therefore cannot establish whether completeness is enforced there or whether atomic application succeeds. It also does not establish that either protection is absent.
The following comparison separates what was read from what would need additional evidence. The final column is an integration inference and recommendation, not observed behavior.
| Boundary | Captured source finding | Inferred integration check |
|---|---|---|
| Findings prerequisite | Four named tools require findings; ask_human does not | Preserve the tool-specific distinction rather than inventing a universal terminal gate |
| Resolution payload | Required strings, per-entry shape and duplicate issue IDs are checked | Inspect how the authoritative linked-Issue set is compared with the submitted set |
| Server effect | Declarations request atomic application and pre-ack dispatch | Obtain executor and transaction evidence before treating acknowledgement as a durable result |
| External model input | Shared wrapping escapes boundary syntax and supplies instructions | Verify replacement-backend routing through that boundary |
| Follow-up | Surviving-session continuation differs from successor follow-up | Represent which path occurred instead of promising session survival |
External evidence has its own boundary
The shared content-boundary implementation makes the caller identify external content, escapes boundary syntax and wraps that content with instructions not to obey attempts to change permissions, tool policy, workflow or higher-priority instructions. This is a concrete source-level handling mechanism, not evidence that a model will always follow the wrapper.
The model-backed runner type requires contentBoundaryVersion. Its documentation says human messages, repository text, telemetry and other externally supplied fields must pass through the shared boundary before entering model context. Types and comments establish the expected integration behavior; they do not demonstrate that every backend implementation routes every field correctly.
The captured boundary test file contains assertions concerning close-tag injection, forged wrappers, ordinary evidence characters, trusted assignment wording and structured JSON wrapping. These are assertions read, not tests passed: no tests were executed for this audit. Their presence supports a description of the intended cases, not a runtime security guarantee.
Integration inference and recommendation: review context routing separately from outcome validation. Keeping the findings prerequisite while bypassing external-data handling would preserve only part of the declared contract. Conversely, preserving the wrapper would not prove linked-Issue completeness or transaction success. These boundaries answer different questions and should not substitute for one another in an integration review.
Continuation is conditional, not one immortal session
The captured lifecycle source names active, terminal and dormant states and guards transitions. The inspected run code distinguishes continuation of a surviving provider session from a successor follow-up after termination. This is a static lifecycle distinction, not a demonstrated live resumption result.
Integration inference and recommendation: do not turn “follow-up supported” into “the same provider session survives.” A replacement backend should preserve the distinction between continuation and successor work in its integration contract. For a related examination of provenance and surviving state, see Claude Code rewind depends on who changed the file.
What changed since the archived overview
This rebuild preserves the historical URL and publication date but changes the editorial question. Rather than treating a telemetry overview as enough to explain operational trust, it asks what evidence connects findings, accepted payloads and declared server effects. This is a change in the article’s analysis, not a claim about when Superlog changed or a reconstructed product-history diff.
The source reading now distinguishes three levels that an overview can easily compress: a findings prerequisite, visible argument validation and declared server-side application. The first two have captured worker-side evidence. The third has a declared contract but lacks the captured executor, authoritative linked-Issue comparison and transaction implementation needed to assess its realization.
Integration inference: the practical consequence is a narrower acceptance criterion for a backend replacement. Matching a tool schema is not enough evidence to call the whole integration equivalent. The review should also account for external-content routing, the four-tool findings rule, conditional session continuity and the unverified server-effect boundary. This is a proposed review standard, not a report of an integration that passed or failed.
Limits and the next integration decision
This article is a static implementation and type-contract audit. No Superlog product, provider, database, worker, test, security or compatibility execution was performed. Nothing here establishes a proven vulnerability or a failed server operation. In particular, an uncaptured completeness check must not be described as a nonexistent completeness check.
Integration inference and recommendation: before accepting findings as an incident-resolution receipt, request evidence for the remaining transition: which linked-Issue set is authoritative, where it is compared with the submitted outcomes, how atomic application is implemented and what acknowledgement actually confirms. Keep those questions separate from whether the worker accepted well-formed arguments.
The useful next comparison is Engineering Discipline’s handoff contradicts its gate, another source audit focused on a worker-to-validator handoff. Read it to compare declared gates with evidence of completed operation, rather than to assume that naming a validator establishes the outcome.
Key Takeaways
- The visible findings prerequisite applies to four named tools, not terminal
ask_human. - Resolution validation checks payload details; the stronger linked-Issue and atomic-application obligations remain declarations within this captured scope.
- Boundary tests were read, not run, and lifecycle source distinguishes surviving-session continuation from successor follow-up.
- Integration inference: preserve each contract separately and obtain execution evidence before treating an accepted outcome as resolution proof.
New Questions
Integration follow-up questions, not findings: Where does the server compare the submitted outcomes with the authoritative linked-Issue set? What establishes atomic application and the meaning of success acknowledgement? How does a replacement backend demonstrate external-content routing and distinguish a surviving session from successor work? Those answers would extend this audit; the captured source does not supply them.
References
All primary sources below are pinned to the same commit and were read on 2026-10-16.
Outcome and backend contracts
Input handling and assertions
Lifecycle and repository context
Editorial method: claims in this article point to primary documentation, pinned source code, runnable checks, or dated measurements, with AI-assisted research under the site's evidence-gated policy. How this site verifies claims and discloses AI assistance · Report a correction.
Working on something like this?
I take a small number of paid, scoped reviews: AI agent/RAG architecture diagnosis, Unity CI & build-automation audits, and multimodal QA design review. Each one ends in a written findings document.
Work with me